📘 Know-howZones5 min read
Zone vs frost date: two different numbers for one garden
Quick answer
Your zone tells you how cold the coldest winter night gets, on average. Your frost dates tell you when freezing nights stop in spring and start again in fall. They come from different data and answer different questions. Boston and Spokane are both zone 7a, yet Spokane's typical last spring frost comes 22 days later and its first fall frost 28 days sooner. Use the zone to pick plants that live through winter and the frost dates to time planting.
Source: USDA Plant Hardiness Zone Map (2023), checked October 6, 2026; PRISM 2023 USDA hardiness zone GIS datasets and zip-code listing, checked October 6, 2026; NOAA 1991-2020 U.S. Climate Normals, annual/seasonal, checked October 7, 2026.

The basics
Two numbers, two questions
The USDA zone comes from one reading a year: the coldest night of each winter, averaged over 1991 to 2020 and sorted into 10°F zones and 5°F half zones. It answers one question: can this plant live through my winter?
Source: USDA Plant Hardiness Zone Map (2023), checked October 6, 2026; USDA ARS, how the 2023 map was made, checked October 6, 2026.
Frost dates come from NOAA's climate normals for the same 30 years. For each weather station, NOAA works out the date of the last 32°F night in spring and the first one in fall. They answer a different question: when can tender plants go out, and how long is the season between freezes?
Source: NOAA 1991-2020 U.S. Climate Normals, annual/seasonal, checked October 7, 2026; NOAA 1991-2020 annual/seasonal normals documentation, checked October 7, 2026.
- 1 nightper winter goes into the zone: the coldest oneUSDA Plant Hardiness Zone Map (2023), October 6, 2026
- 32°Fthe night-time low NOAA uses for frost datesNOAA 1991-2020 annual/seasonal normals documentation, October 7, 2026
- 1991 to 2020the years behind both numbersNOAA 1991-2020 U.S. Climate Normals, annual/seasonal, October 7, 2026
- 50 dayslonger typical season in Boston than in Spokane, both zone 7aNOAA 1991-2020 U.S. Climate Normals, annual/seasonal, October 7, 2026
Same zone
Same zone, different calendar
Zip code 02108 in Boston and 99201 in Spokane are both listed as zone 7a. At the nearest NOAA station to each, the typical last spring frost is April 4 in Boston and April 26 in Spokane. The typical first fall frost is November 9 in Boston and October 12 in Spokane. That's 219 days between the typical frosts in Boston and 169 in Spokane.
Source: PRISM 2023 USDA hardiness zone GIS datasets and zip-code listing, checked October 6, 2026; NOAA 1991-2020 U.S. Climate Normals, annual/seasonal, checked October 7, 2026.
The gap gets wider in mild places. Seattle (98101) and Charleston, South Carolina (29401) are both zone 9a. Seattle's nearest station has 249 days between typical frosts and Charleston's city station has 329.
Source: PRISM 2023 USDA hardiness zone GIS datasets and zip-code listing, checked October 6, 2026; NOAA 1991-2020 U.S. Climate Normals, annual/seasonal, checked October 7, 2026.
Same date
Different zones, same spring
It works the other way too. Minneapolis (55401) is zone 5a, Columbus, Ohio (43215) is 6b and Spokane is 7a. That's two whole zones, or 20°F of difference on the coldest night. Yet the typical last spring frost at their nearest stations falls on April 23, April 20 and April 26.
Source: PRISM 2023 USDA hardiness zone GIS datasets and zip-code listing, checked October 6, 2026; USDA Plant Hardiness Zone Map (2023), checked October 6, 2026; NOAA 1991-2020 U.S. Climate Normals, annual/seasonal, checked October 7, 2026.
Plan the year
Which number to use, step by step
Find your zone
Type your zip code into the zone finder. Note the zone, letter and all.
Source: PRISM 2023 USDA hardiness zone GIS datasets and zip-code listing, checked October 6, 2026.
Check perennials against the zone
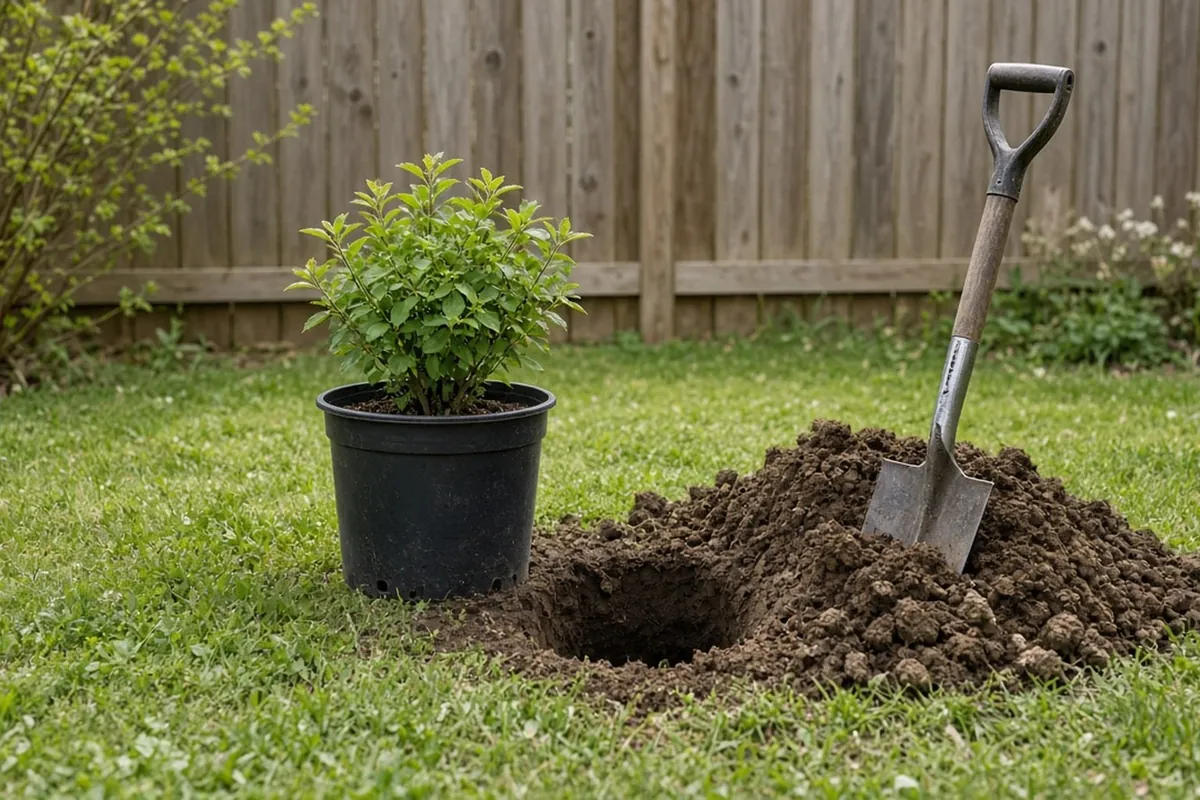
For shrubs, trees, bulbs and other plants that stay in the ground all year, compare the zone range on the tag with your zone. That's a winter question, and the zone answers it.
Find your frost dates
Type the same zip code into the frost date lookup. It shows the typical and the 1 in 10 dates at the three nearest NOAA stations.
Source: NOAA 1991-2020 annual/seasonal normals documentation, checked October 7, 2026.
Time planting from the frost dates
Seed packets that say "after the last frost" or "6 weeks before the last frost" mean your date from the lookup, not anything tied to the zone.
Write both on one card
Print the frost date card, put your zone at the top beside the NOAA dates, and add the frosts you see each year.
The reason
Why the two drift apart
The zone looks at one extreme night. Frost dates look at the edges of the cold season. A place with a mild coldest night but a long, cool spring, like Spokane next to Boston, can share a zone and still have a much shorter season. A place with a sharp cold snap but a quick spring can sit in a colder zone with an early last frost.
Height, distance from water and city heat move frost dates from one station to the next, even within a few miles. The frost date lookup shows three stations for that reason.
Source: NOAA 1991-2020 U.S. Climate Normals, annual/seasonal, checked October 7, 2026.
Print it, tick it off
Zone and frost date card
Fill this in once, keep it with your seed packets, and check it before each planting.
- My zone from the 2023 zip code listing
- The NOAA station I chose, and why (closest, same height, same setting)
- Typical last spring frost and the 1 in 10 later date
- Typical first fall frost and the 1 in 10 earlier date
- Days between the typical dates
- Perennials checked against the zone, annuals timed from the frost dates
- This year's real last and first frost, written down
What people learn the second year
Tips and tricks
- Look both up on the same day. Run the zone finder and the frost lookup with the same zip code and copy both onto one card. Most mix-ups start with a zone from one site and a date from another.
- Ignore frost dates printed by zone. A chart that gives one date per zone can be weeks off for your town. Use the date for your zip code.
- Count back from the date, not the zone. When a packet says to start seeds indoors some weeks before the last frost, count back from your own typical date.
- Write down the real frosts. After a few seasons, your notes show whether your yard runs earlier or later than the station.
Common questions
Questions
Is my hardiness zone the same as my frost date?
No. The zone comes from the average coldest winter night. Frost dates come from when 32°F nights end in spring and begin in fall. Two places in the same zone can be weeks apart on frost dates.
Source: USDA Plant Hardiness Zone Map (2023), checked October 6, 2026; NOAA 1991-2020 annual/seasonal normals documentation, checked October 7, 2026.
What is the last frost date for zone 7?
There isn't one. Boston and Spokane are both zone 7a, and their typical last spring frosts at the nearest NOAA stations are April 4 and April 26. Look up your own zip code instead.
Source: PRISM 2023 USDA hardiness zone GIS datasets and zip-code listing, checked October 6, 2026; NOAA 1991-2020 U.S. Climate Normals, annual/seasonal, checked October 7, 2026.
Which number do seed packets mean?
Packets that time planting around "the last frost" mean your local last frost date. Zone ranges on packets and tags are about winter survival for plants that stay in the ground.
Do frost dates change when zones change?
They're separate products. The 2023 zone map and the frost dates on this site both use 1991 to 2020 data, but a zone move doesn't shift your frost dates by any set amount.
Source: USDA ARS, how the 2023 map was made, checked October 6, 2026; NOAA 1991-2020 U.S. Climate Normals, annual/seasonal, checked October 7, 2026.
The arithmetic, done for you
Tools for this job
- ❄️ LookupFrost date lookup by zip codeFind the typical last spring and first fall frost for your zip code from NOAA 1991 to 2020 station normals, with the 1 in 10 year dates and a printable card.Open the tool
- 🌡️ LookupUSDA zone finder by zip codeFind your 2023 USDA plant hardiness zone by zip code, see its winter low band in °F and °C, and check a plant tag's zone range against it.Open the tool
Keep reading
More guides
 🧰 Problem solverIt froze after the last frost date: how to read the oddsA last frost date is a coin flip, not a promise. How NOAA's 50% and 1 in 10 dates work, how to pick the right station, and which date to plan around.Read the guide
  🧰 Problem solverOne corner of the yard frosts first: find and fix a frost pocketFrost in the low corner but not by the house? Cold air drains downhill on still nights. How to find a frost pocket, open it up and plant around it.Read the guide
  📘 Know-howHow deep to mulch garlic in cold zones, and when to pull the mulch backExtension pages put 3 to 4 inches of straw or leaves on fall garlic. See how much a bed takes, and when to pull it back, move it or leave it in spring.Read the guide
 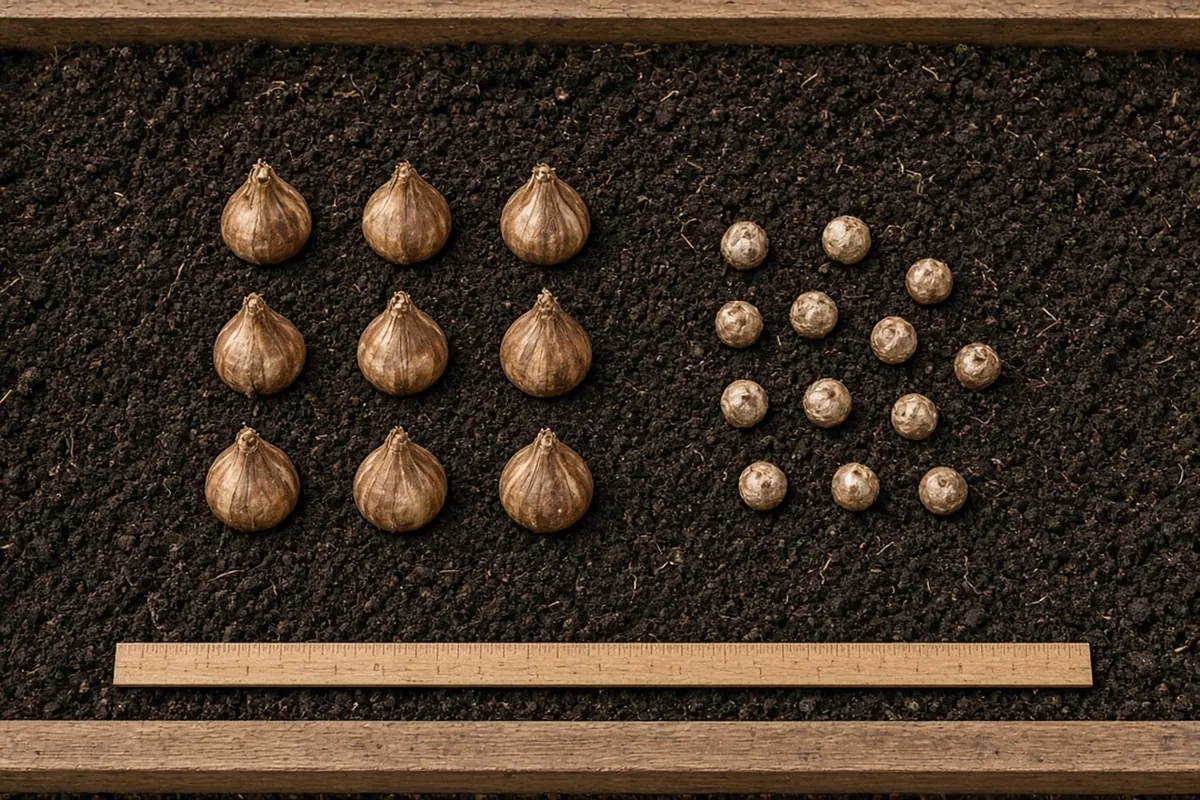 📘 Know-howHow many bulbs per square foot: tulips, daffodils and crocusTulips and daffodils at 6 inches apart come to 4 bulbs per square foot; crocus at 3 inches, 16. See the extension spacings and count a whole bed.Read the guide
Sources
- 2023 USDA Plant Hardiness Zone Map, USDA Agricultural Research Service. Checked October 6, 2026.
- 2023 USDA Plant Hardiness Zone GIS Datasets, PRISM Group, Oregon State University (for USDA). Checked October 6, 2026.
- U.S. Climate Normals (1991-2020), annual/seasonal normals by station, NOAA National Centers for Environmental Information (NCEI). Checked October 7, 2026.
- Map Creation, USDA Plant Hardiness Zone Map, USDA Agricultural Research Service. Checked October 6, 2026.
- 1991-2020 U.S. Climate Normals documentation: Annual/Seasonal Normals, NOAA National Centers for Environmental Information (NCEI). Checked October 7, 2026.
Planning guide, not a guarantee. See every source on the site on the sources page. Spotted an error? Tell us.